
For Peloton Owners, Hardware + Software = Delight
- Peloton’s hardware + service led to high delight
- The community contributed to high retention and engagement
- The product attracted customers outside of hardcore cyclists
We were excited to run our Delight Scale on Peloton and see if it truly stood up to the glowing fanfare coming from consumers on social media. Sure enough, Peloton scored a 960, out of the possible 1200, on our Delight Scale with some of the most overwhelming positive sentiment of any consumer product we have studied thus far.
I can think of few companies that benefited more from the COVID-19 pandemic than Peloton. As gyms closed and consumers wanted to stay fit and active, Peloton was easily the consumer hardware darling of the Pandemic. To confirm this point, we asked Peloton owners how much they agreed with the statement “The COVID-19 pandemic influenced my decision to purchase a Peloton,” and 67% of respondents had some level of agreement, with 28% strongly agreeing with the statement.
As we studied Peloton the hardware product, it became clear to us that Peloton the software and service product played a much more significant role in Peloton’s overall Delight score. It was the combination of great hardware and great software service that led to the continued delight of Peloton owners.
As the chart below depicts, Peloton owners were delighted with a range of Peloton features that extend beyond the hardware and into the service provided.
One key finding that came out from the study is the ability of hardware, software and service to drive a higher Delight Score than any one of these three single components of the product. The total Peloton experience is measured with more than hardware, which is relatively unique in consumer markets. Peloton owners showed equally high levels of delight with the Peloton software/service as they did with the Peloton hardware. Together, Peloton created a highly engaging and sustainable customer value proposition.
Key to the Peloton product story is also the community of Peloton owners and their ability to engage with each other and the trainers. In a qualitative study we ran leading up to the quantitative study, a clear sense of community amongst the customer base transpired. As part of the quantitative study, we asked a range of questions to gauge how engaged the community is with each other. Giving high-fives to the leaderboard and returning high-fives were among the most frequent activities. Engaging with the leaderboard in a race or reviewing stats of those on the leaderboard were also consistent activities. Maybe the result of the isolation coming from the Pandemic, 38% of Peloton owners frequently use the video chat feature with a friend while actively riding.
The trainers also play into the overall experience since they help make the Peloton service active and dynamic. We asked Peloton owners who their favorite trainers were, and the most popular, in order, were Alex Touissant, Ally Love, and Cody Rigsby. The top three most listed reasons why these trainers were their favorite were:
- They are inspirational
- They give clear instructions
- They are funny
Perhaps one of the most interesting discoveries of our study was how Peloton was able to attract and sustain engagement with entirely new customers to the category. For example, exactly 40% of respondents in our study did not consider themselves avid cyclists, nor did they regularly participate in any indoor or outdoor cycling activity. Yet, this “new to cycling” cohort maintained an average workout time of 45 minutes three times a week. Moreover, this workout routine remained pretty consistent with this cohort even for those who owned the Peloton for more than six months, which is generally when new product honeymoon phase ends.
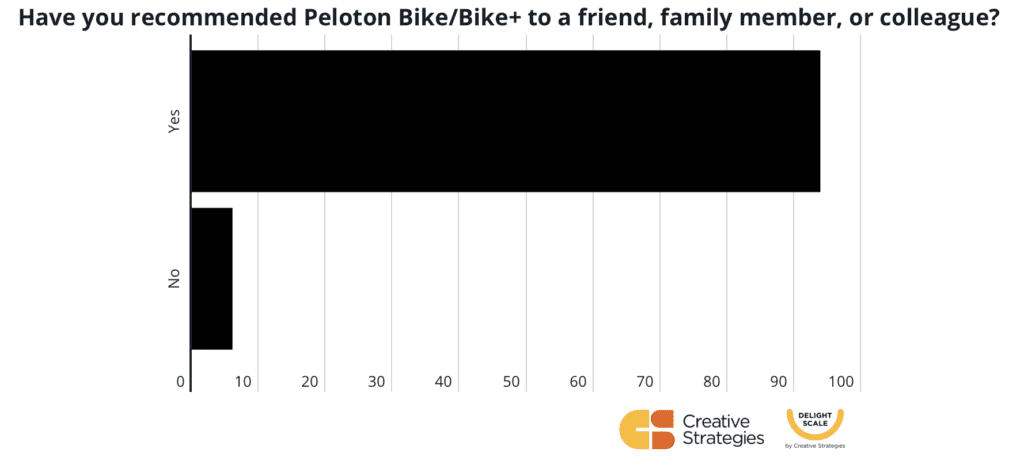
Peloton scored highly in nearly all our Delight Scale benchmark questions. In addition, it maintained extremely high overall product quality scores. It received 4.6 out of 5 stars. And knowing much of the momentum Peloton gained from the pandemic came from extremely high praise and word of mouth recommendations. So it was not a surprise that a whopping 94% of Peloton owners in our study did recommend Peloton to another person.
Peloton has impressively grown its market beyond just hardcore cyclists and has been able to sustain engagement across the board. Our benchmarks with the Delight Scale confirm Peloton is a hit with consumers, and the sustained engagement and strong word-of-mouth endorsements from fans bode well for the product and Peloton as a company.
Methodology:
The study was run in the US in February/March 2021 across 900 consumers who answered the questionnaire online and were not compensated for participating in the study.
The Delight Scale is built on the ten best questions prepared to capture product experience across a series of products from hardware to apps as well as services. It captures willingness to recommend the product prompted and unprompted, customer satisfaction in relation to expectations, sentiment on price, intention to repurchase, and more. The results are scored, weighted, and aggregated into a product’s Delight Score.
The Delight Scale utilizes questions with a 7-point satisfaction scale that ranges from one extreme attitude to another with one neutral option. The Likert Scale is a popular and well-known question format used to measure opinions and behavior. Likert-type questions provide more granular feedback about a product compared to binary questions with their two answer options.
The maximum Delight Score a product or service can achieve is 1200. In order to achieve such a score, respondents would have to select the top 2 boxes for all the scoring questions. Rather than allocating a score to all possible answers, the Delight Score uses a Top 2 Box score (sometimes called T2B) in the way of summarizing the positive responses from a Likert Scale. The Top 2 Box score technique is used across research to help with ad testing, product development, and brand tracking. This approach has proven to lead to a much more holistic measurement of customer experience, actionable product insights to truly separate great products from average ones. Selecting the top 2 boxes for 60% of the questions would place a product or a service on a Delight Score of around 700.